Making cool globe maps with Matplotlib
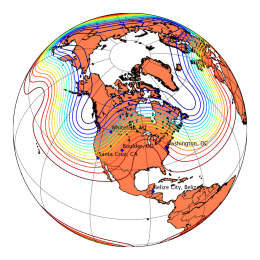 My favorite plotting package combination (matplotlib, SciPy and Python) has a neat example how to use the 'basemap' toolkit to make maps. In 18 lines of code you have a globe. Another 12 you can show some cities and another 10 lines and you are plotting curves along the surface of the globe. Take a look.
via Simon Willison

Comments